


-
- Trading Platforms
- PU Prime App
- MetaTrader 5
- MetaTrader 4
- PU Copy Trading
- Web Trader
- PU Social
-
- Trading Conditions
- Account Types
- Spreads, Costs & Swaps
- Deposits & Withdrawals
- Fee & Charges
- Trading Hours


EN
18 June 2025,15:00
Basic Forex EducationBeginnerForex Technical AnalysisHow-toTechnical Analysis
18 June 2025, 15:00

If you’re trading forex or just starting to explore the world of currencies, learning to read forex charts is one of the most important skills you’ll need. These charts show how currency pairs behave in real-time, helping you spot trends, analyse price movements, and decide when to enter or exit a trade.
Forex charts are used by traders around the world to understand what the market is doing right now and to forecast where it might go next. Whether you’re following a currency pair like EUR/USD or GBP/JPY, these charts can reveal key details such as opening and closing prices, highs and lows, and how much momentum is behind a move.
In this article, we’ll break down the main types of forex charts you’ll see, including line charts, bar charts, and candlestick charts, and explain what each one tells you about the market’s price behaviour. You’ll also learn how to spot chart patterns, understand support and resistance zones, and start reading forex charts with more confidence.
By the end, you’ll have a clearer picture of how Forex charts display pricing data and how to use that information to improve your trading decisions. Whether you’re trading short-term patterns or trying to assess long-term trends, mastering chart reading is a must.
Forex charts are visual tools that show how the price of a currency pair has changed over time. They help traders track the market’s behaviour, spot trends, and make informed decisions when trading forex.
At their core, forex charts are simply a way to display pricing data for a financial instrument, in this case, a currency pair like USD/JPY or AUD/USD. Each chart shows how the currency pair’s price has moved during a specific time period, whether that’s one minute, one hour, one day, or even longer.
A typical price chart includes information like the opening price, closing price, highest price, and lowest price traded during each interval. By looking at how those prices developed over time, traders can better understand whether the market is trending up, down, or moving sideways.
Charts are essential in forex trading because they help you understand what can otherwise be a fast-moving and complex market. They don’t predict the future, but they help traders understand what’s happened in the past, and that’s a big part of making smart decisions going forward.
Whether you’re trading a single currency pair or monitoring several, forex charts are the starting point for analysing the market and planning your next move.
Regarding trading forex, there’s more than one way to look at the market. Your platform will likely offer a few different types of forex charts, each with strengths depending on your trading style and goals. Let’s go over the four most common ones.
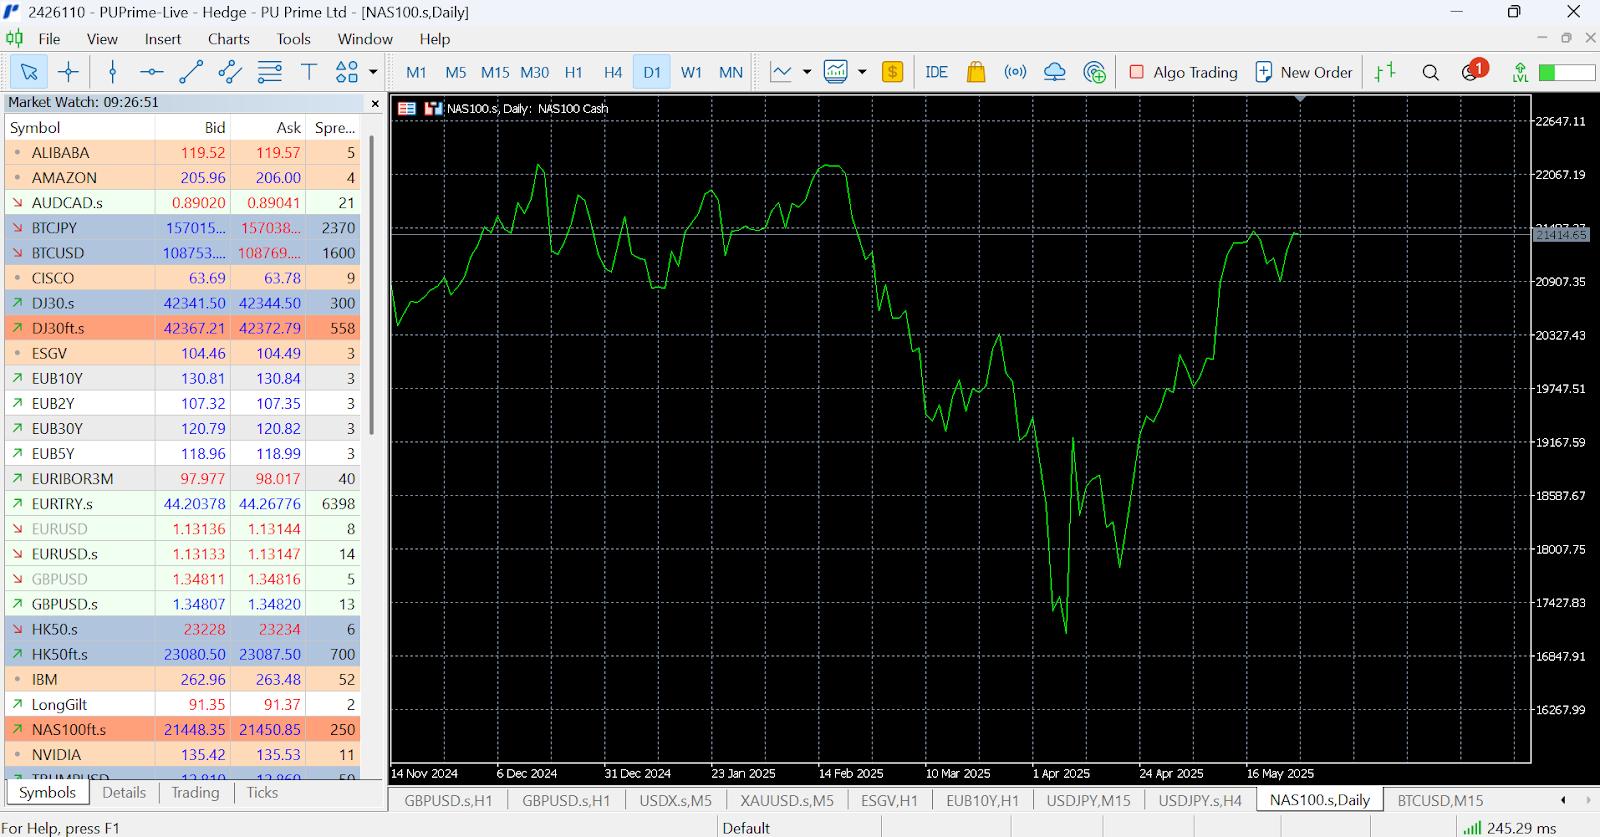
A line chart is the simplest type of chart. It connects a series of closing prices with a line, giving you a clean, minimalist view of how a currency pair’s price has moved over time. Because it shows only the closing price for each period, it’s great for spotting broader market trends without being distracted by short-term volatility.
Unlike other chart types, a line chart doesn’t show the opening price, high or low, just where the market finished during that period.
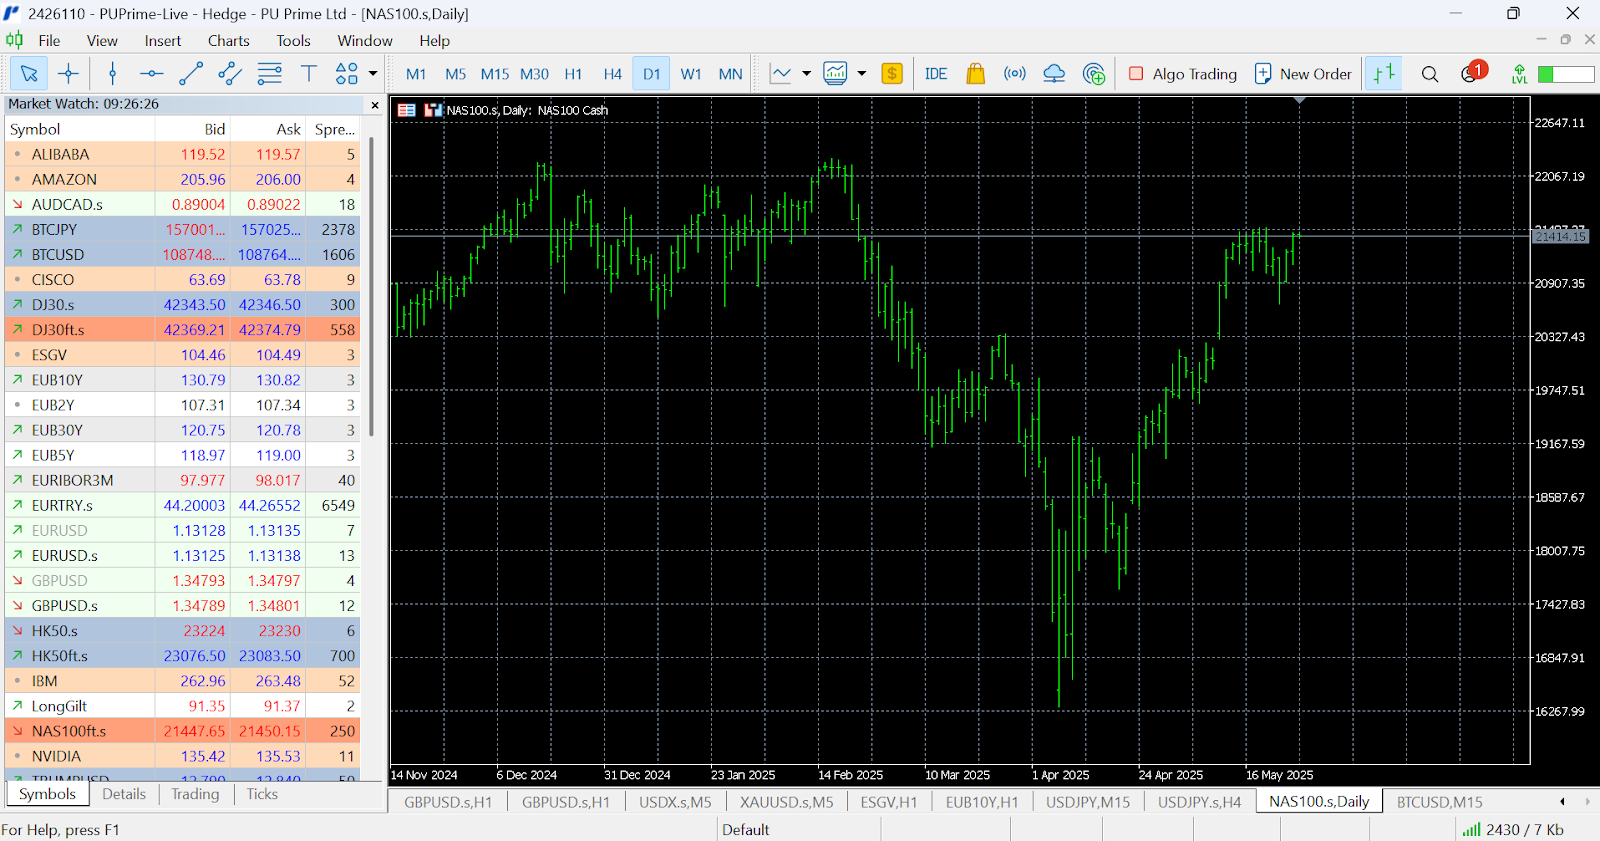
A bar chart adds more detail than a line chart. Each bar represents a single time period and shows the opening and closing prices and the highest and lowest prices traded during that time.
It’s a more advanced option than a simple line, and it helps you see price movements within each candle, making it popular among forex traders who like more granular data. The vertical line on each bar shows the full price range for that time period.
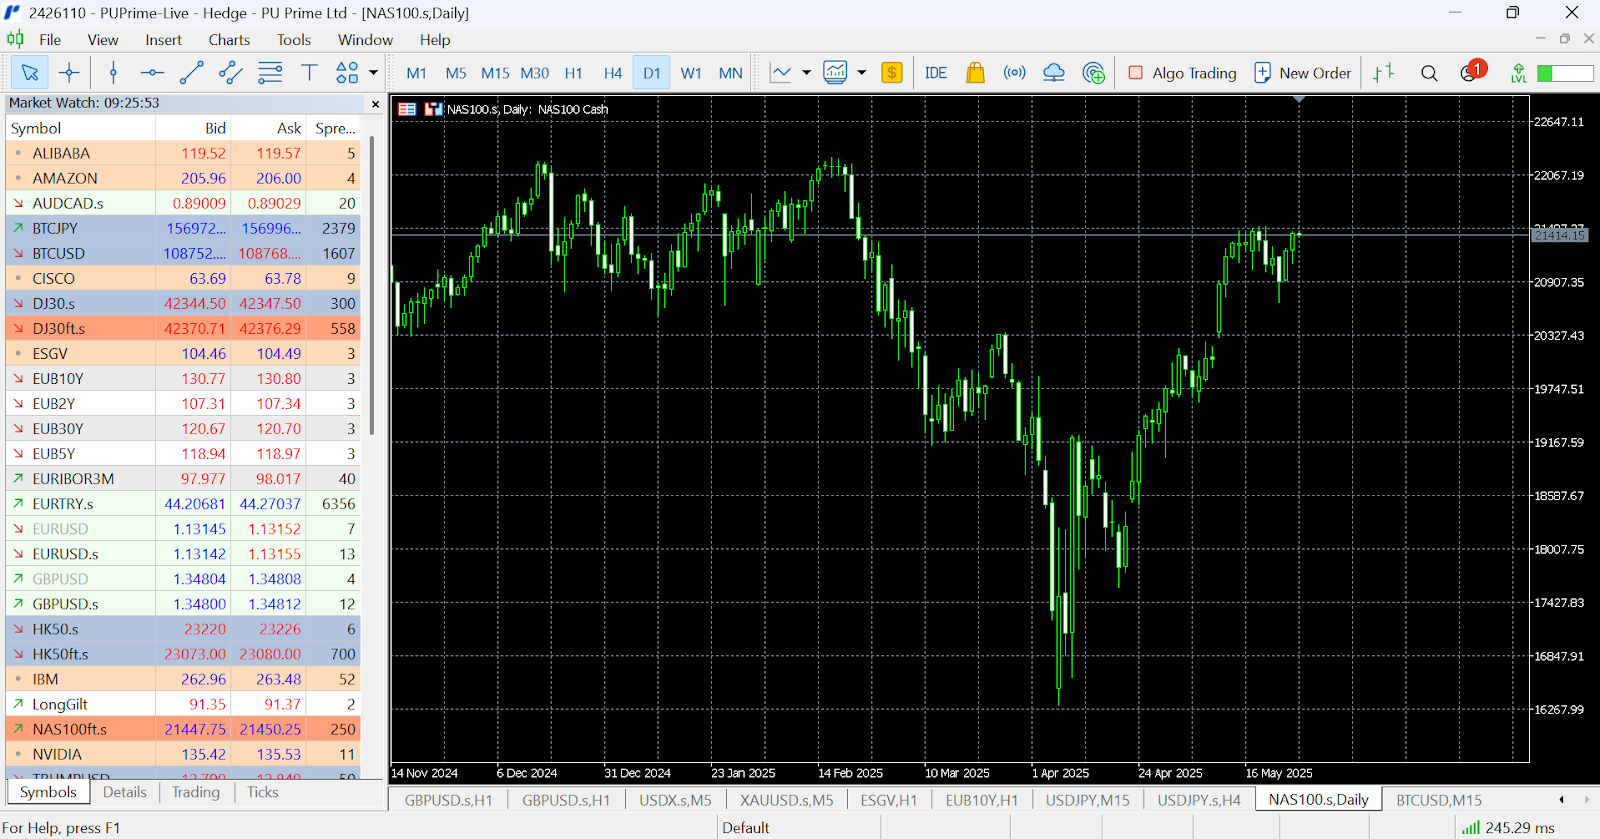
The candlestick chart is one of the most popular tools in forex trading charts. Like bar charts, candlesticks show the opening price, closing price, highest price, and lowest price for each period. But they do it in a visual format that’s easier to read quickly.
A green candlestick typically shows that the price went up during that period (closing above the opening), while a red one shows that it went down.
Because a candlestick clearly shows price movement, many experienced traders rely on this format to spot chart patterns, buying pressure, and selling pressure at a glance.
A mountain chart is a variation of the line chart, often shaded underneath the price line to resemble a mountain. Like a line chart, it focuses on closing prices and smooths out the noise.
It’s visually appealing and straightforward to read, making it a good fit for newer traders or those wanting to assess long-term trends without too much detail.
Before you can confidently read forex charts, it helps to understand what all the elements on the screen mean. No matter which type of chart you use, whether it’s a line chart, bar chart, candlestick chart or mountain chart, the basics stay the same. These components tell the story of how a currency pair’s price moved during a specific time period.
The opening price is the first price a currency pair trades when a new time interval begins. On a one-hour chart, for example, this would be the price at the start of that hour. It gives you a starting point to compare how the price behaves over that period.
The closing price is where the currency pair finishes trading by the end of the time interval. Many forex traders consider it one of the most important values, primarily when analysing price charts or making trading decisions based on how sessions end.
Also called the high, this is the most a currency pair was bought or sold for during the time interval. It’s often shown at the top of a vertical line on bar charts and candlestick charts.
This is the lowest price traded for that currency pair in the same time interval. It marks the bottom of the vertical line on bar and candlestick charts and helps traders understand the full range of price movements.
Every price chart has a price scale on the side. This scale shows current prices and helps you visualise how far prices have moved over time.
Whether you’re using a candlestick chart or a line chart, the price scale anchors what you see to real market values.
Together, these elements help traders assess how the market is behaving. If the closing price is near the high, it could suggest strong buying interest. Sellers may have had more control during that session if it’s near the low.
Watching how these pieces interact helps you better understand price movements and prepare for what might come next.
Reading forex charts might initially feel overwhelming, but it can become second nature with some practice.
1. Start with the Basics
First, look at which currency pair you’re analysing. Whether it’s EUR/USD or AUD/JPY, every forex chart shows how that pair’s price has changed across a chosen time period (minutes, hours, days or even weeks).
The vertical axis (price scale) shows the currency pair’s worth, while the horizontal axis shows the time period. When the pair’s price increases, the chart moves up. When it drops, the chart moves down.
2. Look for price movements
Price movements are the ups and downs you see on the chart. They can be sharp and sudden or slow and steady. Your goal is to understand what those moves might be telling you. Did the currency pair climb quickly on strong news? Did it fall after hitting resistance? These are the kinds of clues that charts offer.
3. Spot chart patterns
Forex chart patterns are shapes that appear over time as prices develop. These might include triangles, flags, head and shoulders, or double tops. Traders use these patterns to forecast possible moves in the market. For example, if you spot a continuation pattern like a flag, it might suggest the trend will keep going. A reversal pattern could hint that a change in direction is coming.
4. Study the price action
Price action means watching the market move without relying too heavily on extra indicators. It includes studying how candles or bars behave, where highs and lows form, and whether buyers or sellers are in control. A strong upward push followed by a slight pullback could suggest buying pressure is still there. On the other hand, a sharp drop might signal growing selling pressure.
5. Put it all together
To read forex charts well, combine your understanding of price movements, chart patterns and price action. Ask yourself: Is the currency pair trending? Are there clear areas of support and resistance? Did the pair’s price break through a key level? Are you seeing signs of a breakout or a slowdown?
Once you know how to read forex charts, the next step is using technical analysis. This means studying price charts to help make decisions about future trades. Technical analysis doesn’t rely on news or economic reports. Instead, it focuses on the chart, like where the price has been and where it might go next.
Two key concepts in technical analysis are support and resistance. Support is a price level where a currency pair tends to stop falling and may bounce back up. Resistance is where the price often stops rising and might head back down.
These levels form because many forex traders place their buy or sell orders around the same prices. For example, if a currency pair has bounced off 1.2000 several times in the past, traders will watch that level closely again in the future.
Spotting these levels on a chart can help you confidently plan entries, exits, or stop-loss placements.
To go a step further, many traders use technical indicators. These are tools added to a chart to give extra insight into the market. Some of the most popular indicators include:
These tools can help confirm what you see on the chart or warn you that a move might weaken.
As you become more comfortable, you can explore more advanced technical analysis techniques. These include using multiple indicators, identifying complex chart patterns, and analysing multiple timeframes to get a fuller picture.
No matter what level you’re at, the key to technical analysis is consistency. Pick a few tools or methods, test them, and learn how they behave over time.
You don’t need to use everything; it’s just what works for you and your trading style.
Whether you’re trading short-term patterns or looking to assess long-term trends, knowing how to use forex trading charts effectively can make a big difference. Here are a few practical tips to help you get more out of your charts, no matter your experience level.
Many experienced traders recommend starting with a simple plan. Decide if you’re focusing on quick trades over minutes or hours or if you’re holding positions for days or weeks. This will help you choose the right timeframes and chart settings.
If you’re trading short-term patterns, you might look at 5-minute or 15-minute charts to catch quick moves. For longer trends, daily or weekly charts give a better view of how the currency pair has been moving over time.
There’s no perfect chart for everyone. Some traders prefer candlestick charts for their visual detail, while others like line or bar charts for simplicity. Your choice often comes down to personal preference and what helps you make decisions more clearly.
You can also try out different chart types and timeframes in a demo account to see what feels most natural.
Looking at more than one timeframe can give you extra perspective. For example, you might spot a strong upward trend on a daily chart but notice a pullback on a shorter timeframe. This can help you time your entries and exits more effectively. Similarly, comparing charts for different currency pairs can help you confirm market strength or weakness across the board.
It’s easy to overcrowd your chart with too many indicators. Start simple, add tools gradually, and remove anything that doesn’t add value. The goal is to make sense of price action and not to get distracted by too much information.
Charts are just one part of the puzzle in forex trading. Used well, they can help you stay focused, manage risk, and make more informed decisions.
Over time, specific shapes appear repeatedly on forex trading charts. These are known as chart patterns, and many traders use them to try to understand where the market might go next.
While no pattern is guaranteed to predict future direction, they can offer valuable clues when combined with other tools.
Chart patterns are visual formations created by price movements. They reflect the balance between buying pressure and selling pressure over a period of time.
Patterns form as traders react to news, economic data, and global events, which creates recognisable shapes on the chart.
Some of the most common forex chart patterns include:
Often seen at the end of an uptrend, this pattern suggests that buying pressure is weakening and that a potential reversal may be coming.
These patterns show that the price has tried twice to break through a level but failed.
A double top suggests resistance and possible downward movement, while a double bottom signals support and potential for the pair’s price to rise.
Triangle patterns reflect a period of consolidation where the range narrows. Eventually, price tends to break out in one direction, often continuing the prior trend.
These short-term patterns form after a strong price move, followed by a brief pause or pullback. If the breakout continues in the same direction, it may signal that momentum is still strong.
Many forex traders use these historical chart patterns to spot potential setups or areas of interest. However, patterns work best when confirmed with other signals, such as volume or support and resistance zones.
Remember that market conditions can change quickly; relying on a pattern alone can lead to false signals.
Understanding chart patterns can help you recognise common market scenarios and respond more confidently.
The more you practise spotting these patterns in real time, the more useful they’ll become in your trading approach.
Learning to read forex charts is one of the most important steps for any new or experienced trader. These charts show how a currency pair’s price has moved over time and help traders make sense of price movements in real time. Whether you’re using a line chart for a quick overview or a candlestick chart for more detail, understanding the chart types and what they show can give you a better chance of spotting opportunities.
By studying chart patterns and combining them with technical analysis, you can begin to forecast FX prices more confidently. There’s no perfect method, and the market’s price can shift quickly, but having a clear system for reading forex charts can help you trade with more structure and less guesswork.
For forex traders looking to improve, the next step is to practice. Use demo accounts, study historical charts, and test your strategy. The more time you spend reading charts, the more natural it becomes.
Want to put what you’ve learned into practice? PU Prime gives you access to a wide range of markets through CFDs, including indices, forex, and more.
You can test forex trading in a risk-free demo environment or explore a real-time setup with flexible trading tools.
Head to PU Prime to learn more and see how the platform works for you.
FAQ
What is the best type of chart for forex trading?
There’s no single best option. Many traders prefer candlestick charts for their detail, but bar charts and line charts can be helpful, too. It depends on your trading style and what you’re trying to learn from the market’s price.
What’s the easiest type of forex chart to start with?
Line charts are a great starting point. They show the closing prices over time in a simple, easy-to-read format without all the noise. Once comfortable, you can move on to a bar or candlestick chart for more detail.
Can I use Forex charts to forecast price movements?
Yes, but with caution. Forex charts don’t predict the future with certainty. They offer a way to make educated guesses based on past data. Always pair your chart reading with sound risk management.
Why do many forex traders use technical analysis?
Charts help understand short-term trends and price changes. They give structure to what can feel like a noisy market, making it easier to act with a plan.
Do I need to understand technical indicators to read charts well?
Not at the beginning. You can learn a lot from price action and chart patterns alone. Once you’re confident reading charts, adding indicators like moving averages or RSI can help confirm your setups and reduce false signals.
What’s the difference between the currency pair’s price and the market’s price?
The currency pair’s price refers to the rate between two currencies. The market’s price refers to the broader pricing environment, which includes spreads and liquidity. They’re closely related but not exactly the same.

Trade forex, indices, metal, and more at industry-low spreads and lightning-fast execution.
Sign up for a PU Prime Live Account with our hassle-free process.
Effortlessly fund your account with a wide range of channels and accepted currencies.
Access hundreds of instruments under market-leading trading conditions.
Trading Platforms
Learn
About PU Prime
Corporate

Please note the Website is intended for individuals residing in jurisdictions where accessing the Website is permitted by law.
Please note that PU Prime and its affiliated entities are neither established nor operating in your home jurisdiction.
By clicking the "Acknowledge" button, you confirm that you are entering this website solely based on your initiative and not as a result of any specific marketing outreach. You wish to obtain information from this website which is provided on reverse solicitation in accordance with the laws of your home jurisdiction.
Thank You for Your Acknowledgement!
Ten en cuenta que el sitio web está destinado a personas que residen en jurisdicciones donde el acceso al sitio web está permitido por la ley.
Ten en cuenta que PU Prime y sus entidades afiliadas no están establecidas ni operan en tu jurisdicción de origen.
Al hacer clic en el botón "Aceptar", confirmas que estás ingresando a este sitio web por tu propia iniciativa y no como resultado de ningún esfuerzo de marketing específico. Deseas obtener información de este sitio web que se proporciona mediante solicitud inversa de acuerdo con las leyes de tu jurisdicción de origen.
Thank You for Your Acknowledgement!