PU Prime App
Exclusive deals on mobile


PU Prime App
Exclusive deals on mobile
Hold The Global Markets In Your Hands
Our trading mobile app is compatible with most smart devices. Download the App now and start trading with PU Prime on any device, anytime and anywhere.


10 May 2024,05:25
Daily Market Analysis
10 May 2024, 05:25


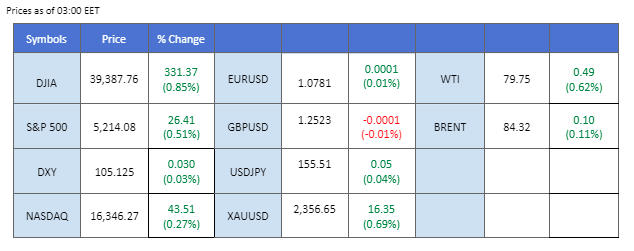
Following the market’s digestion of last Friday’s soft Nonfarm Payrolls report, the dollar index (DXY) initially showed signs of recovery, inching towards the $106 mark and mitigating previous losses. However, the dollar’s upward momentum was abruptly halted by the release of the latest U.S. Initial Jobless Claims data, which surged to levels unseen since last November. This unexpected spike in jobless claims has reignited speculation that the Federal Reserve may adhere to its original plan of initiating interest rate cuts, consequently weakening the dollar further. Market participants are eagerly awaiting next week’s U.S. Consumer Price Index (CPI) reading to confirm expectations for rate cuts.
In response to the weakened dollar, gold prices experienced a notable upswing, buoyed by the renewed dovish sentiment surrounding U.S. monetary policy. Meanwhile, oil prices recorded a two-day climb as the U.S. job data supported expectations of forthcoming Fed rate cuts, consequently boosting economic activity and fine-tuning the demand outlook for crude oil.
On the other hand, the Bank of England (BoE) announced its decision to hold interest rates unchanged, aligning with market expectations. However, the accompanying statement from the BoE hinted at the possibility of an interest rate cut in the future, potentially preceding actions by the Fed. Initially causing a dip in the Sterling to near one-month lows, the currency eventually strengthened following the release of the upbeat U.S. job data.
Current rate hike bets on 12nd June Fed interest rate decision:
Source: CME Fedwatch Tool0 bps (91.5%) VS -25 bps (8.5%)
(MT4 System Time)
Source: MQL5
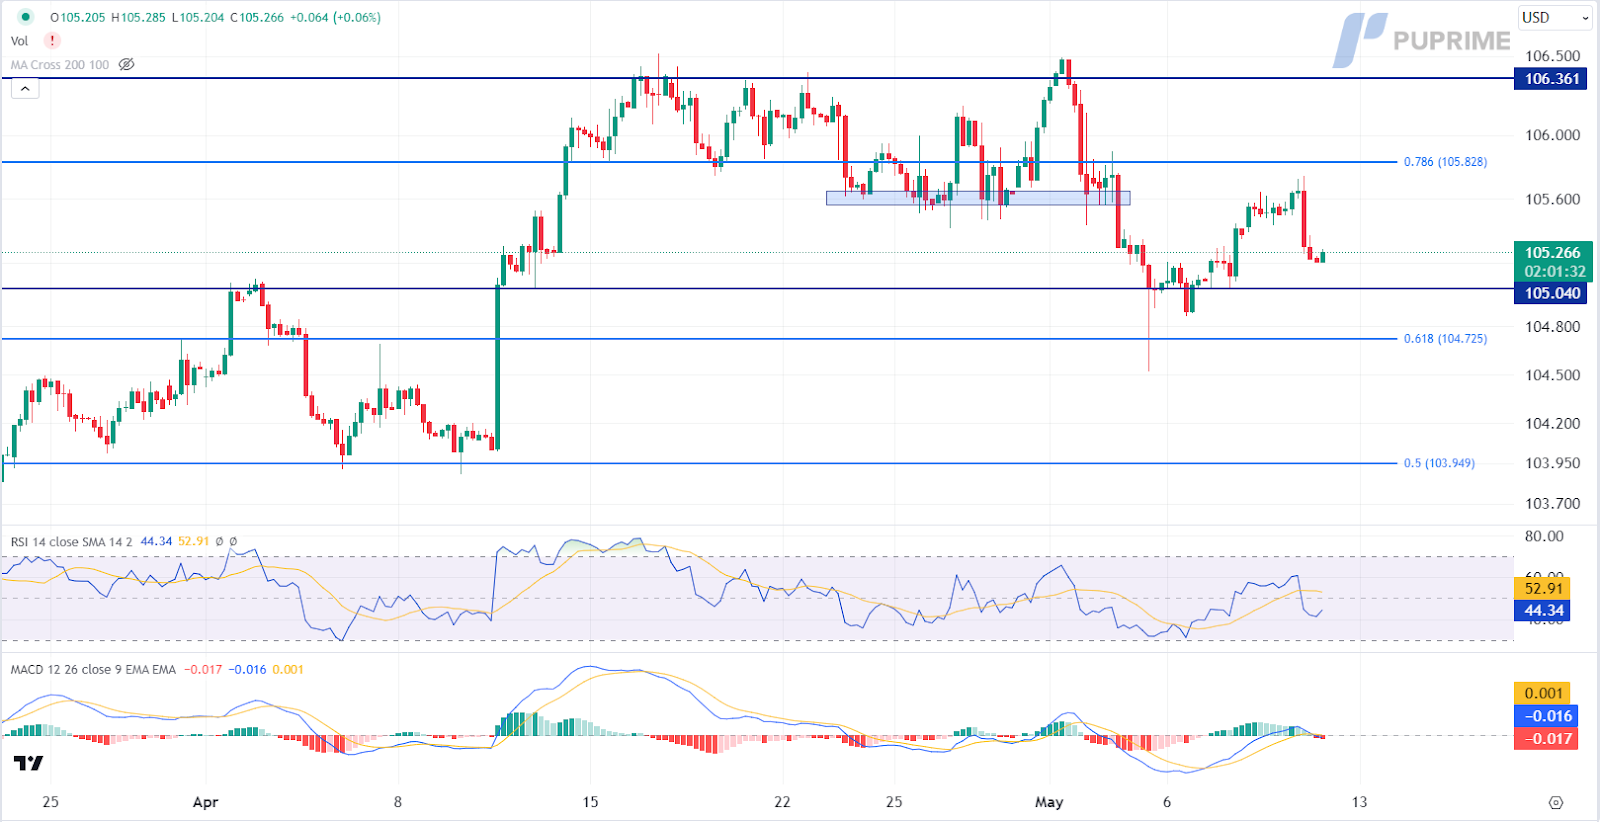
The Dollar Index faced downward pressure as bleak US jobs data emerged, complicating the economic outlook. With Initial Jobless Claims surpassing expectations, concerns mount over the resilience of the US economy, amplifying speculation of potential interest rate cuts by the Federal Reserve. Investor attention now turns to economic indicators for further cues on monetary policy.
The Dollar Index is trading lower while currently near the support level. MACD has illustrated increasing bearish momentum, while RSI is at 44, suggesting the index might extend its losses since the RSI stays below the midline.
Resistance level: 105.85, 106.35
Support level: 105.05, 104.75
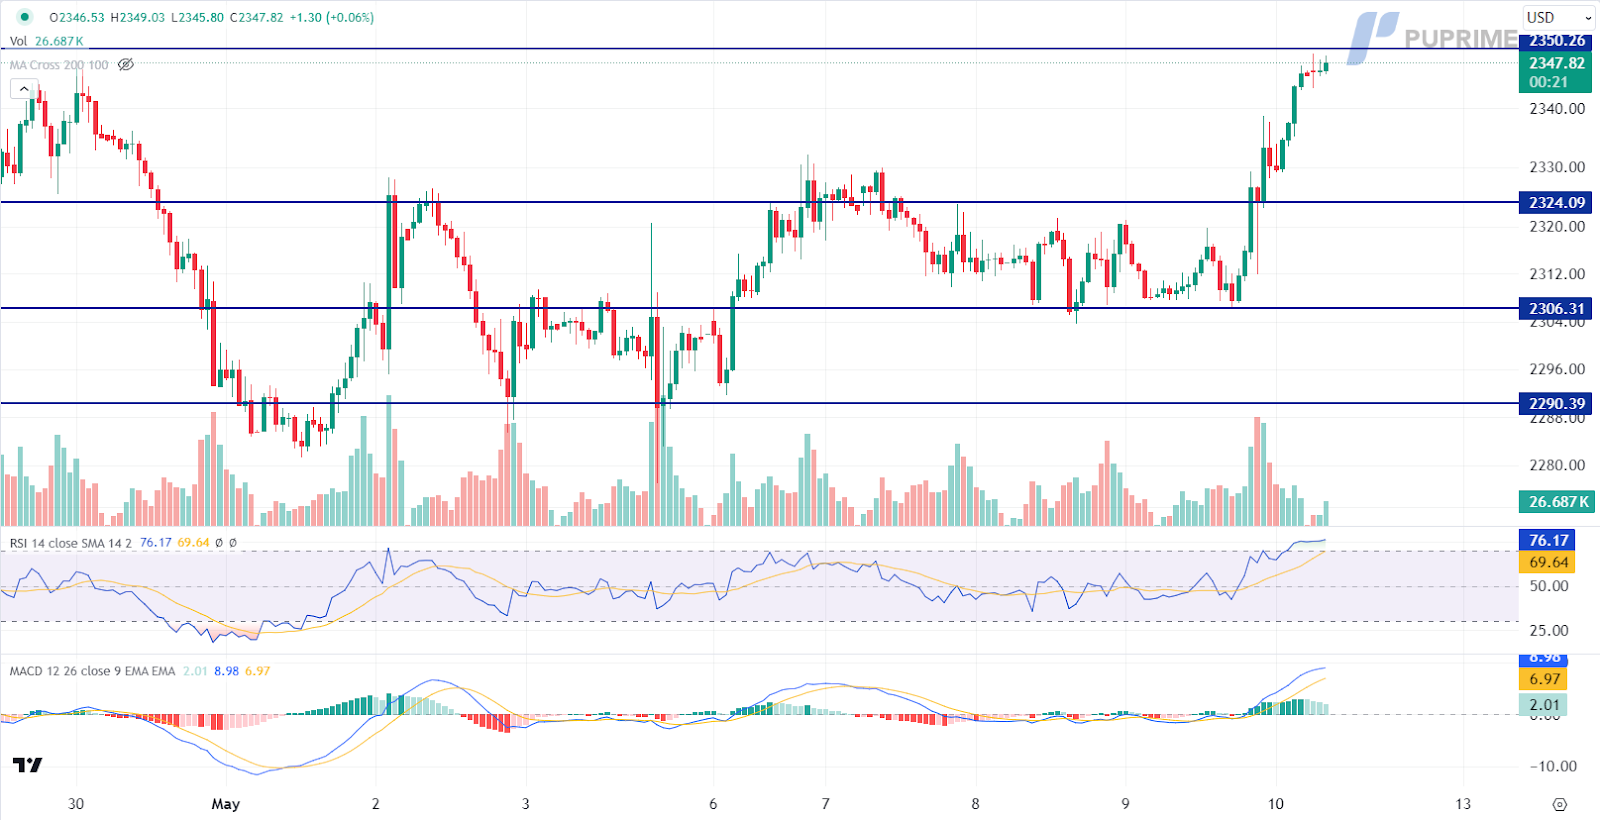
Gold prices surged sharply amidst growing expectations of a dovish shift in Federal Reserve policy. Bleak US economic indicators, including disappointing jobs data, fuel concerns about economic stability, driving investors toward the safe-haven asset. With the US Dollar and Treasury yields under pressure, gold enjoys renewed demand as a hedge against uncertainty.
Gold prices are trading higher while currently testing the resistance level. However, MACD has illustrated diminishing bullish momentum, while RSI is at 76, suggesting the commodity might enter overbought territory.
Resistance level: 2350.00, 2365.00
Support level: 2325.00, 2305.00
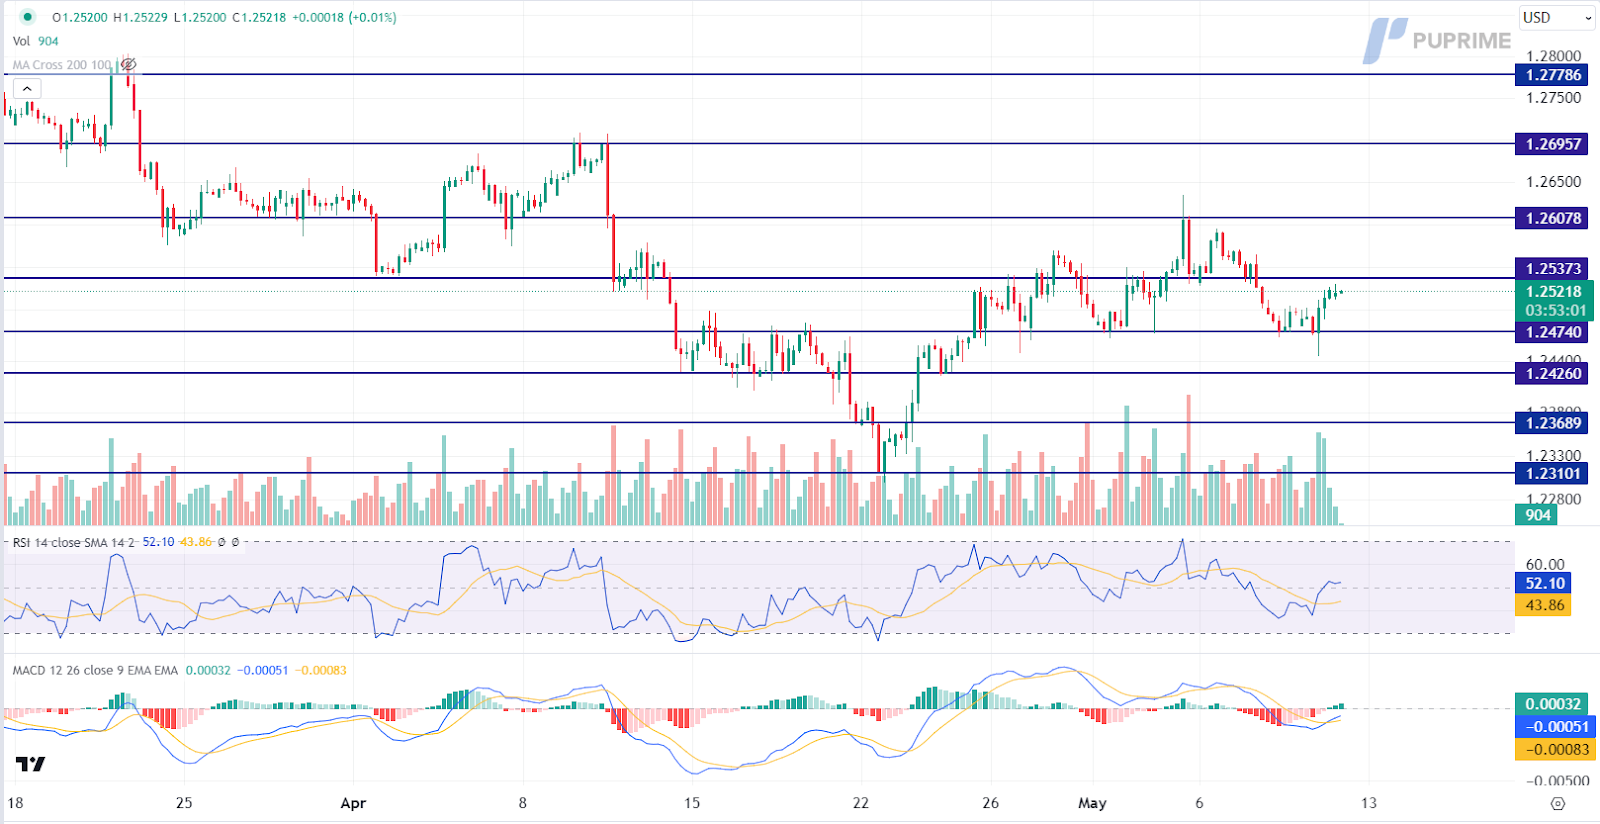
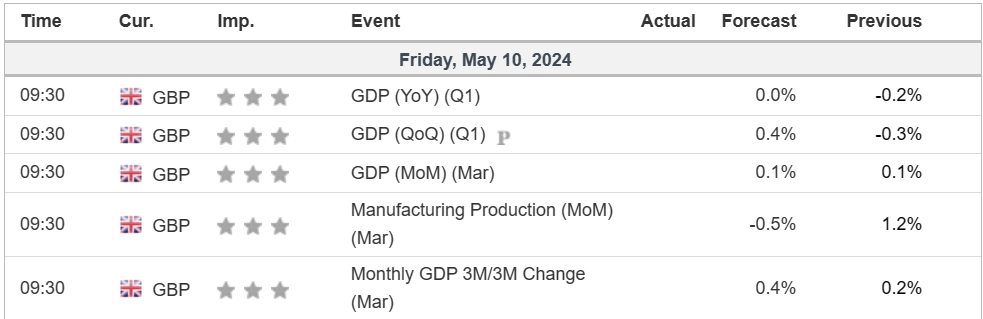
Pound Sterling saw a robust rebound following the Bank of England’s decision to maintain interest rates at a 16-year high. The Monetary Policy Committee’s decisive vote signals a hawkish tilt, reinforcing confidence in the UK economy’s stability. Governor Andrew Bailey’s remarks underscore the central bank’s cautious approach, emphasising the pivotal role of economic data in shaping future rate decisions.
GBP/USD is trading higher while currently testing the resistance level. MACD has illustrated increasing bullish momentum, while RSI is at 52, suggesting the pair might extend its gains after breakout since the RSI stays above the midline.
Resistance level: 1.2535, 1.2610
Support level: 1.2475, 1.2425
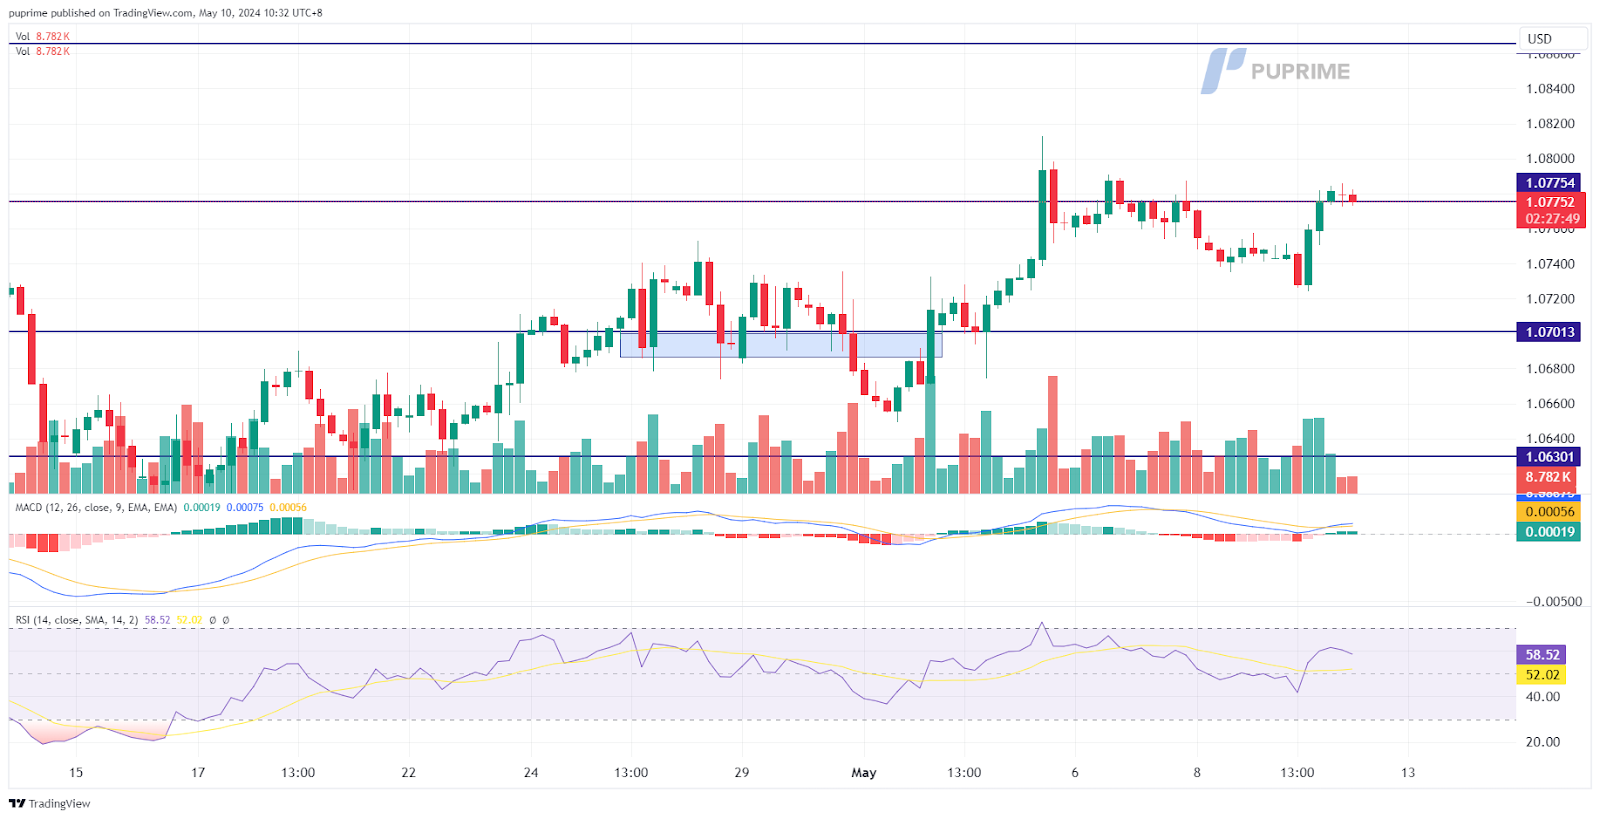
The EUR/USD pair staged a robust rebound in the recent session, regaining ground and approaching its recent peak near 1.0790. This bullish momentum was primarily propelled by encouraging developments in the U.S. job market, particularly the upbeat initial jobless claims data. The improved outlook for U.S. employment conditions has fostered optimism among market participants regarding the potential implementation of monetary easing measures by the Federal Reserve later this year. Additionally, euro traders are closely monitoring today’s release of the European Central Bank (ECB) monetary policy meeting reports. These reports are expected to provide valuable insights into the ECB’s future monetary policy decisions and their potential implications for the euro currency.
The pair has gained and is attempting to break its strong resistance level at near 1.0800 psychologically. The MACD has rebounded above the zero line, and the RSI edge higher suggests that bullish momentum is forming.
Resistance level: 1.0775, 1.0865
Support level: 1.0700, 1.0630
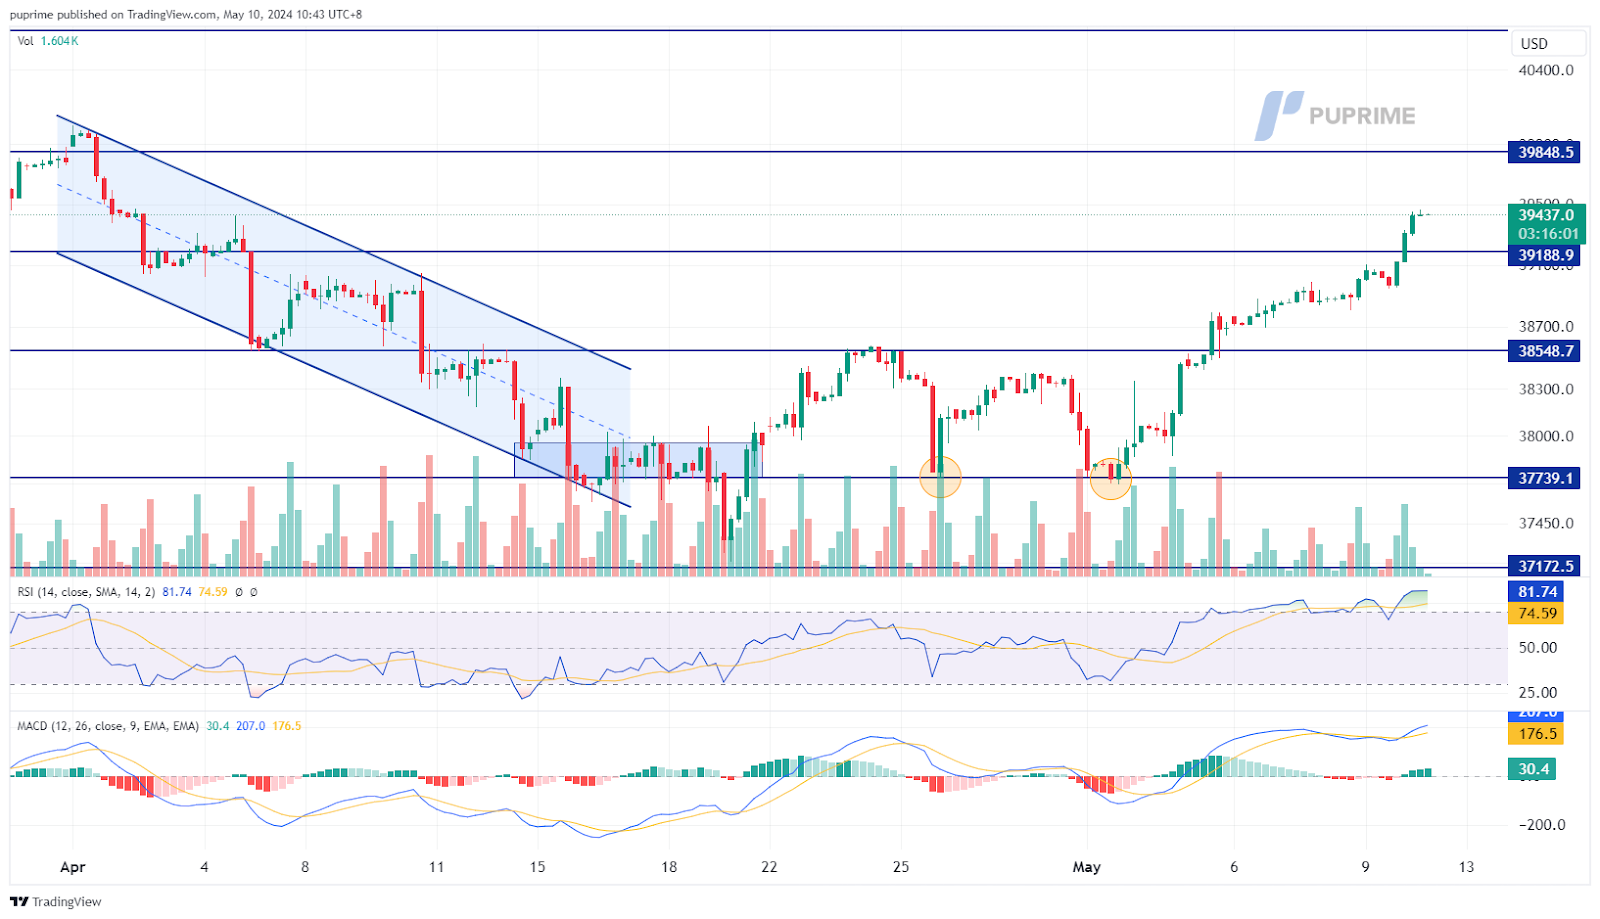
The U.S. equity markets have maintained their bullish momentum, driven by improved risk appetite following the release of recent economic data, particularly yesterday’s U.S. initial jobless claims report. The data, which showed an increase to 231k claims, the highest level since November, indicates a softening job market in the U.S. This has fueled speculation among investors regarding the possibility of an earlier-than-expected interest rate cut by the Federal Reserve.
The Dow Jones is seemingly trading with strong bullish momentum and is trading toward its all-time zenith. The RSI has broken into the overbought zone, and the MACD continues to edge higher above the zero line, suggesting that the bullish momentum remains strong.
Resistance level: 39850.00, 40660.00
Support level: 39190.00, 38550.00
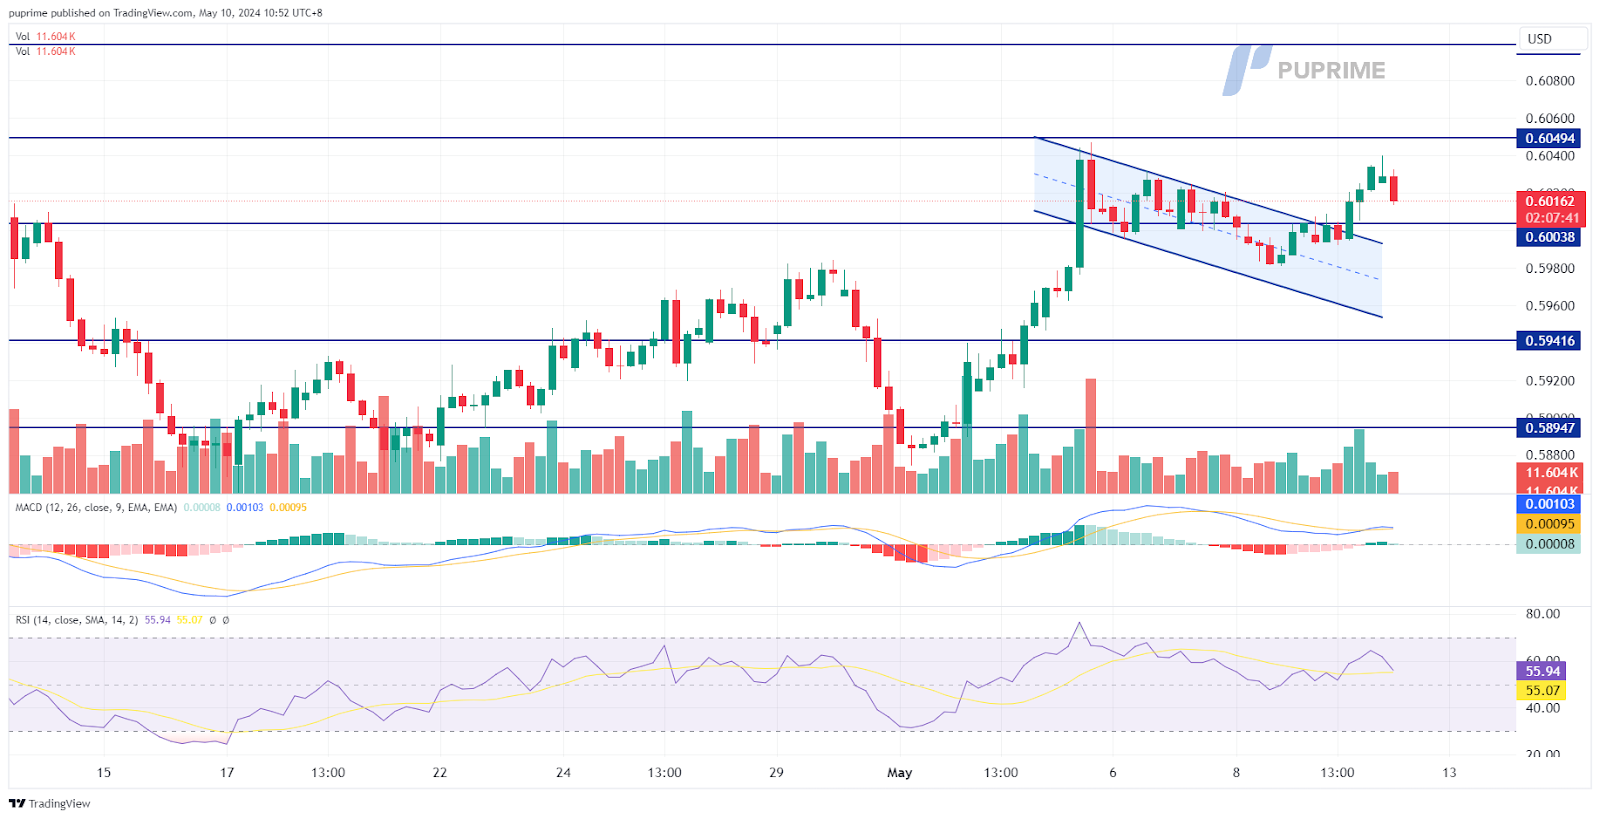
The NZD/USD pair has exhibited a bullish breakout, breaking above its previous downtrend channel and reaching its recent high levels. This shift in momentum suggests a bullish bias for the pair. The upward movement was primarily driven by the weakening of the U.S. dollar following softer-than-expected U.S. job data. Additionally, the New Zealand Business PMI has shown improvement, reaching 48.9, although it remains below the key threshold of 50. Nevertheless, this improvement has contributed to the strength of the New Zealand dollar (Kiwi).
The pair depicts a bullish signal after breaking above from this downtrend channel. The MACD has signs of rebounding before breaking below the zero line, while the RSI edged higher at above 50, suggesting the pair is trading with bullish momentum.
Resistance level: 0.6050, 0.6100
Support level: 0.6000, 0.5950
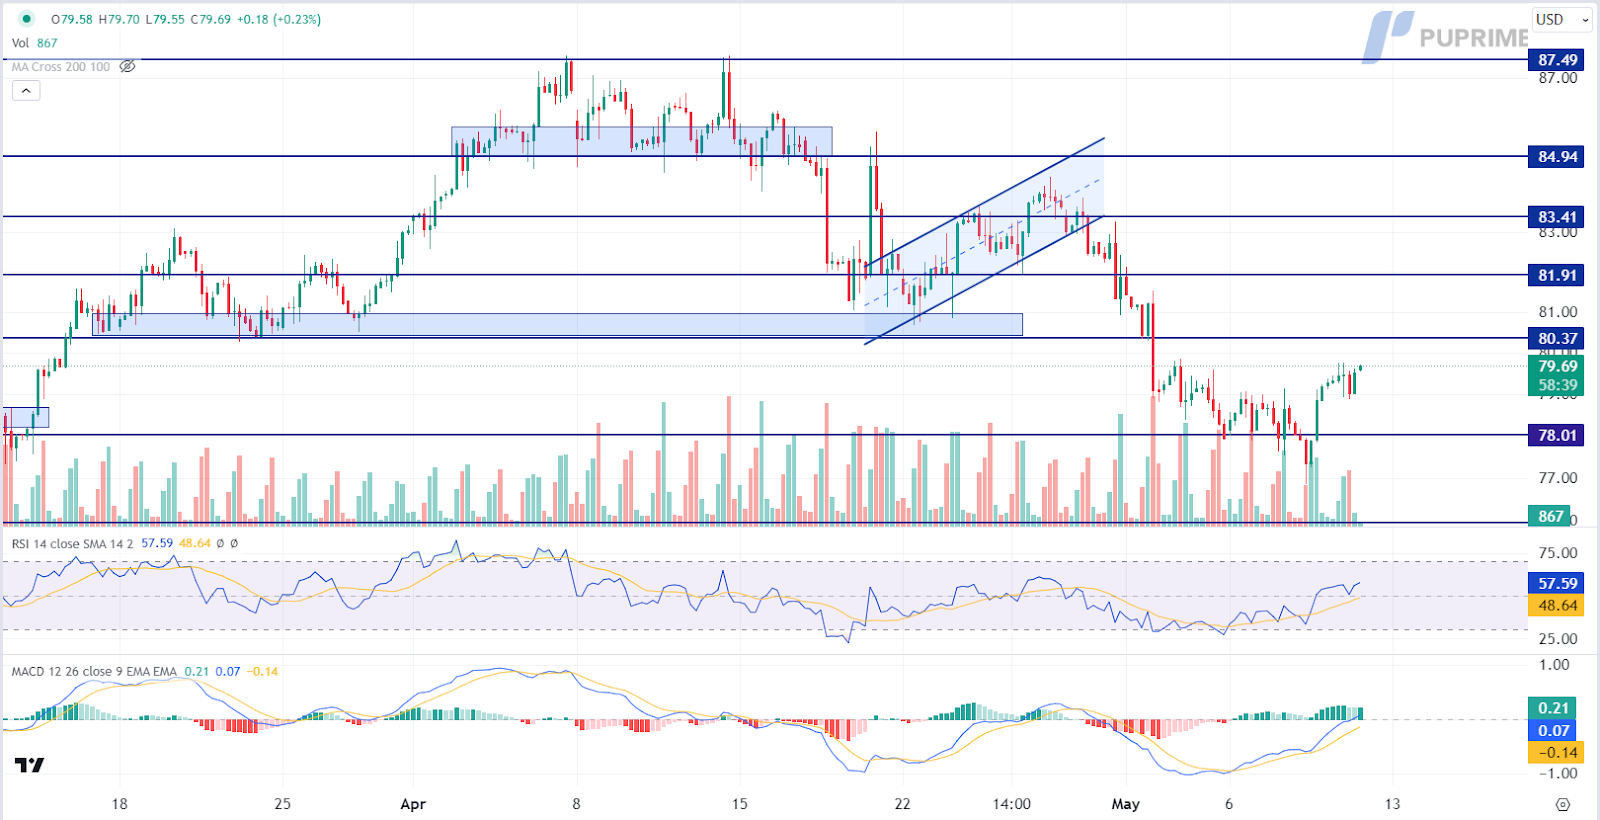
Crude oil prices advanced, buoyed by signs of economic improvement in China and stalled Middle East ceasefire talks. Positive data on Chinese crude oil imports in April coupled with returning growth in exports and imports bolster market sentiment. Additionally, the perceived likelihood of US interest rate cuts, spurred by a cooling job market, underpins oil price gains amidst shifting global dynamics.
Oil prices are trading higher while currently testing the resistance level. MACD has illustrated increasing bullish momentum, while RSI is at 58, suggesting the commodity might extend its gains since the RSI stays above the midline.
Resistance level: 80.40, 81.90
Support level: 78.00, 75.95

Trade forex, indices, metal, and more at industry-low spreads and lightning-fast execution.
Sign up for a PU Prime Live Account with our hassle-free process.
Effortlessly fund your account with a wide range of channels and accepted currencies.
Access hundreds of instruments under market-leading trading conditions.
PU Prime App - Start Trading with an Edge


Risk Warning: Trading Contract for Difference (CFD) carries a high level of risk to your capital and may result in losses that exceed your deposits due to leverage. It's important to understand how CFDs work and assess whether you can afford the high risk of losing your money. When acquiring our derivative products, you do not own or have rights in the underlying assets. Past performance is not indicative of future results. The information on this website is general and does not take into account your personal objectives, financial circumstances, or needs. Seek independent advice from qualified experts if necessary, and ensure you fully understand the risks before making any trading decisions.
PU Prime is a brand name of different entities authorised and registered in various jurisdictions.
PU Prime Limited is authorized and regulated by the Financial Services Authority of Seychelles under License No. SD050, with registered address at CT House, Office 1A, Providence, Mahe, Seychelles.
PU Prime Ltd is authorized and regulated by the Financial Services Commission of Mauritius under License No. GB23202672, with registered address at Suite 201 Level 2, The Catalyst Building, 40 Silicon Avenue, Cybercity Ebene, Mauritius.
PU Prime (Pty) Ltd is an authorised Financial Services Provider registered and regulated by the Financial Sector Conduct Authority of South Africa under License No. 52218, with registered address at 37 Harley Street, Ferndale, Randburg, Gauteng, South Africa.
The information on this website is not intended for residents of certain jurisdictions, including the United States, Singapore, Australia, China, and jurisdictions listed on the FATF and EU/UN sanctions lists. It is not intended for distribution or use where such distribution or use would be contrary to local law or regulation. While the Authority has granted a securities or derivatives investment business licence to the Licensee, it does not endorse the products offered.
Finzero Cap Ltd, registered in the Republic of Cyprus with registration number HE414308 and registered address at 62 Athalassas, Mezzanine, Strovolos 2012, Nicosia, Cyprus.
Copyright © 2024 PU Prime.

Please note the Website is intended for individuals residing in jurisdictions where accessing the Website is permitted by law.
Please note that PU Prime and its affiliated entities are neither established nor operating in your home jurisdiction.
By clicking the "Acknowledge" button, you confirm that you are entering this website solely based on your initiative and not as a result of any specific marketing outreach. You wish to obtain information from this website which is provided on reverse solicitation in accordance with the laws of your home jurisdiction.
Thank You for Your Acknowledgement!
Ten en cuenta que el sitio web está destinado a personas que residen en jurisdicciones donde el acceso al sitio web está permitido por la ley.
Ten en cuenta que PU Prime y sus entidades afiliadas no están establecidas ni operan en tu jurisdicción de origen.
Al hacer clic en el botón "Aceptar", confirmas que estás ingresando a este sitio web por tu propia iniciativa y no como resultado de ningún esfuerzo de marketing específico. Deseas obtener información de este sitio web que se proporciona mediante solicitud inversa de acuerdo con las leyes de tu jurisdicción de origen.
Thank You for Your Acknowledgement!

